2020 US Census: FSM Migrants in Hawaii
According to the 2020 U.S. Census Bureau, Hawaiʻi had nearly 40,000 Micronesian migrants (39,608 total). “Micronesian” referred to people from
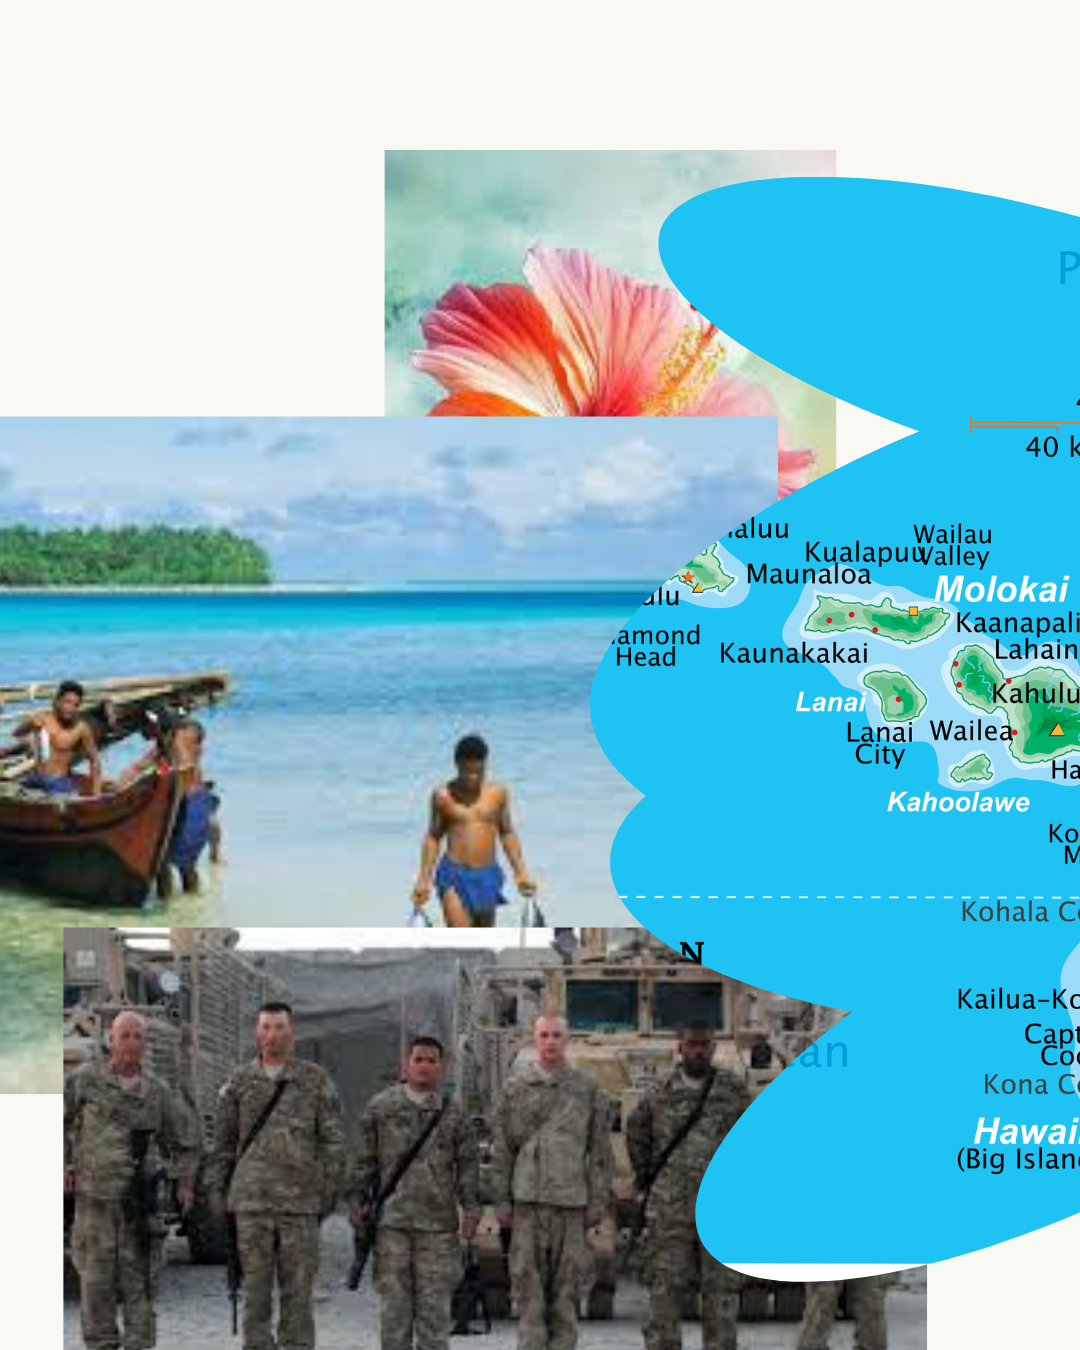
| Statistical Resource for Pacific Islands

According to the 2020 U.S. Census Bureau, Hawaiʻi had nearly 40,000 Micronesian migrants (39,608 total). “Micronesian” referred to people from
Overview of the 1910 hawaii census showing population details across major social categories.
Summary of race and ethnicity in hawaii from 2000 to 2010 using census data.
A look at how hawaii’s racial makeup changed from 1900 to 1990 using census data.
Population of Hawaiian islands in 1900 based on census data, showing how people were distributed across the islands.
Population distribution across Hawaiian islands in 1890 based on census data, showing age, sex, ethnicity, and residency patterns.
Age distribution of native Hawaiians by sex, showing demographic trends among the indigenous population.
A snapshot of occupation status in 1884 Hawaii, revealing the composition of the workforce.
A summary of the 1884 hawaii census, showing population details across different categories and offering insight into the islands demographics.
A look at ethnicity in the hawaiin islands in 1872 and 1878 census.
The 1878 census shows distinct differences in age ranges, sex ratios, ethnic makeup, and foreign-born origins across Hawaiʻi’s populated islands, offering a clear view of how each island’s population differed during that period.
This post looks at how Hawaiʻi’s population was recorded in 1866, focusing on the way people were grouped and counted in the historical census of that year.
The 1860 census recorded individuals according to age, sex, and marital status, giving a framework for understanding the population’s composition during that time.
The 1853 census of the Hawaiian Islands expanded on earlier counts by including age, sex, marital status, disabilities, and religious affiliation. It offers a broader view of Hawaiian society, showing how families, social roles, and personal characteristics were distributed across the population during this time.
The 1849 census of the Hawaiian Islands provides one of the earliest detailed looks at the Native Hawaiian population. It organizes people by age groups and gender, giving a clear picture of how the population was distributed across children, young adults, adults, and elders during this period.
Views: 5603