1920 to 1930 CNMI Population
CNMI Population in 1920 to 1930. This table shows the population in CNMI during the Japanese Era in Micronesia. These tables were found in the UH Manoa Library more will be available to view them electronically as the data are transferred electronically.
| Location | 1930 | Chamorros Only – 1930 | Other Natives | |||||||
|---|---|---|---|---|---|---|---|---|---|---|
| Total | Males | Females | 1925 | 1920 | Total | 0–14 | 15–59 | 60+ | ||
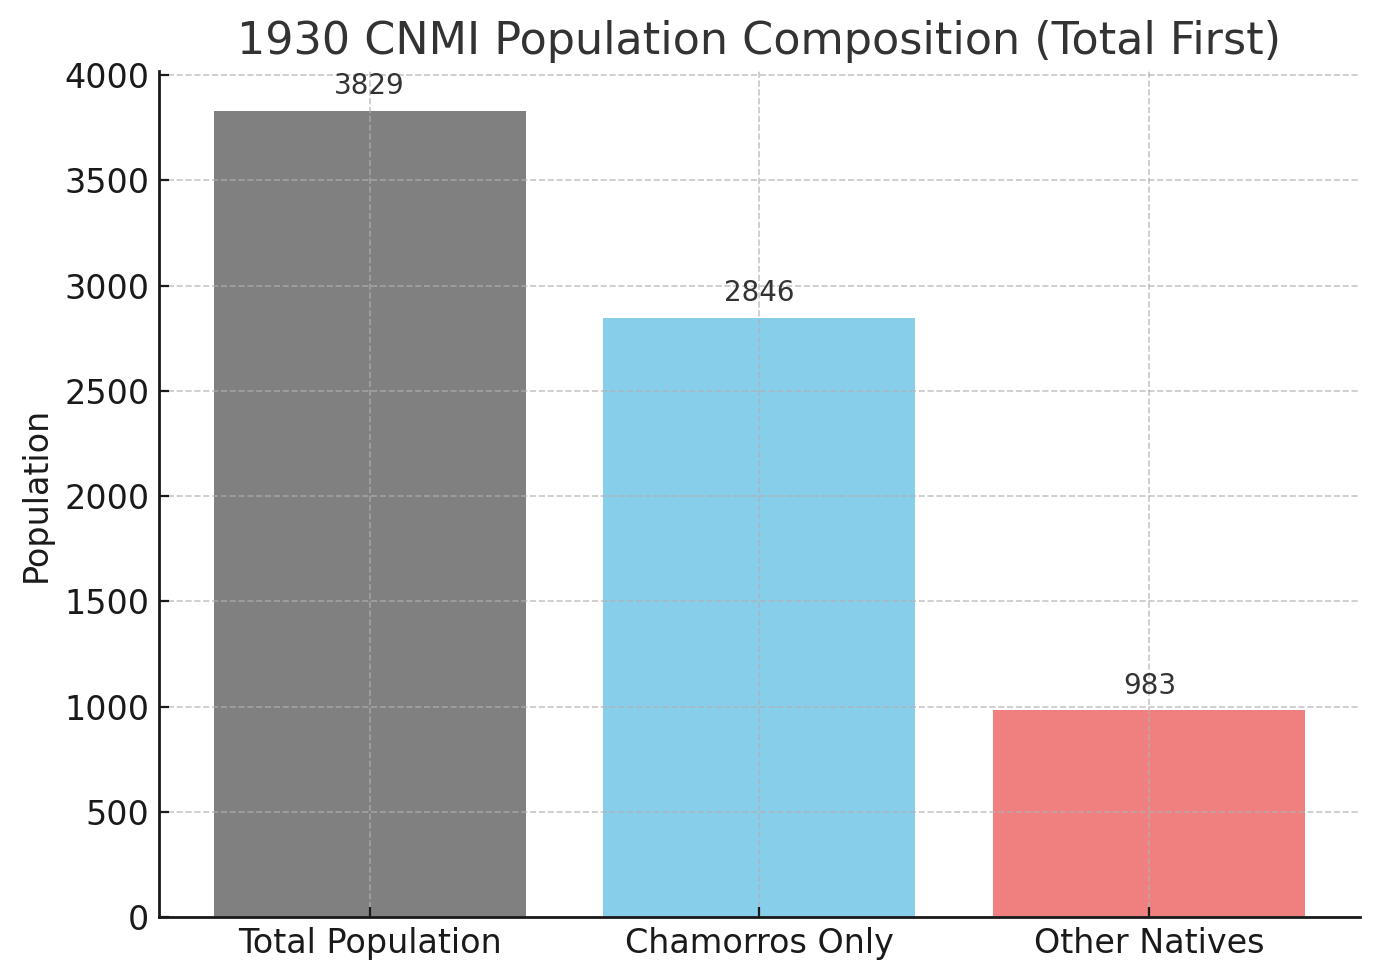
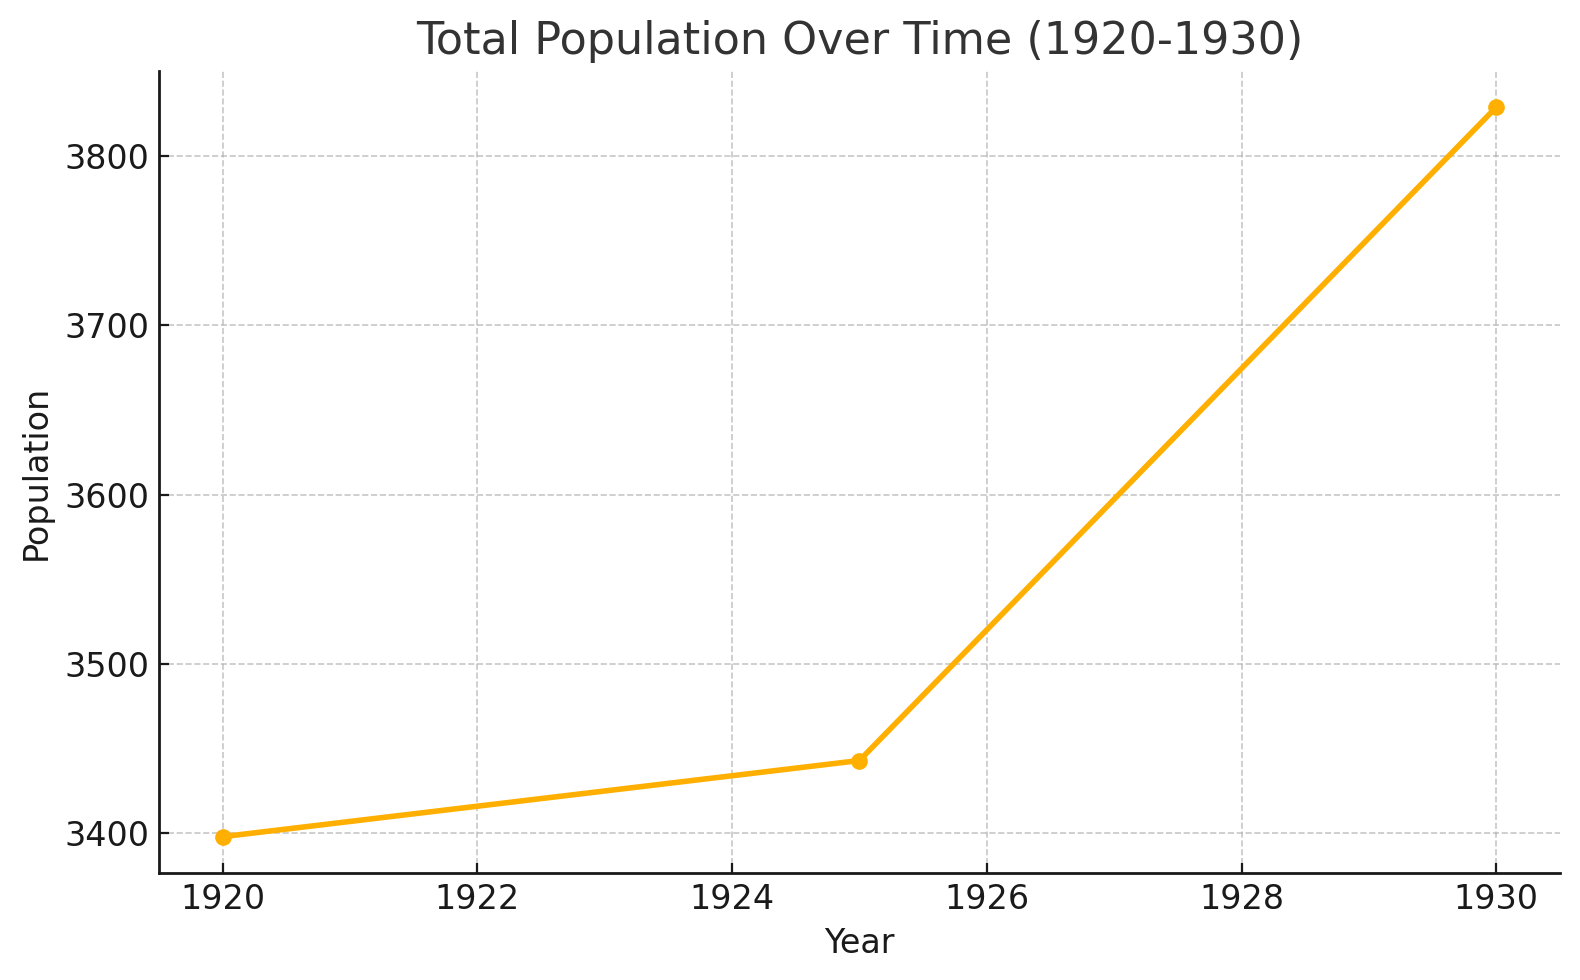
| Total | 3,829 | 1,945 | 1,884 | 3,443 | 3,398 | 2,846 | 1,205 | 1,521 | 120 | 983 |
| Saipan | 2,915 | 1,455 | 1,460 | 2,639 | 2,449 | 2,066 | 888 | 1,090 | 88 | 849 |
| South Garapan | 1,074 | 523 | 551 | 977 | 0 | 387 | 167 | 199 | 21 | 687 |
| North Garapan | 1,592 | 803 | 789 | 1,450 | 0 | 1,576 | 677 | 836 | 63 | 16 |
| Putan Muchai | 6 | 2 | 4 | 0 | 0 | 6 | 2 | 4 | 0 | 0 |
| Fina Ganan | 4 | 2 | 2 | 0 | 0 | 4 | 2 | 2 | 0 | 0 |
| Gualo Rai | 6 | 4 | 2 | 0 | 0 | 4 | 0 | 1 | 3 | 2 |
| Chalan Laulau | 1 | 1 | 0 | 0 | 0 | 1 | 0 | 1 | 0 | 0 |
| Chalan Kanoa | 5 | 3 | 2 | 11 | 0 | 5 | 3 | 2 | 0 | 0 |
| Matanshiya | 0 | 0 | 0 | 1 | 0 | 0 | 0 | |||
| Tanapag | 227 | 117 | 110 | 200 | 0 | 83 | 37 | 45 | 1 | 144 |
| Rota | 644 | 336 | 308 | 487 | 651 | 639 | 267 | 342 | 30 | 5 |
| Tinian | 43 | 29 | 14 | 180 | 112 | 41 | 10 | 31 | 0 | 2 |
| Siniharon | 19 | 14 | 5 | 0 | 0 | 17 | 3 | 14 | 0 | 2 |
| Kahi | 1 | 1 | 0 | 0 | 0 | 1 | 0 | 1 | 0 | 0 |
| Chiro | 1 | 0 | 1 | 0 | 0 | 1 | 0 | 1 | 0 | 0 |
| Marpo | 22 | 14 | 8 | 0 | 0 | 22 | 7 | 15 | 0 | 0 |
| Sariguan Is. | 23 | 11 | 12 | 23 | 186 | 0 | 0 | 0 | 0 | 23 |
| Alamagan | 16 | 10 | 6 | 25 | – | 5 | 0 | 5 | 0 | 11 |
| Pagan | 122 | 67 | 55 | 36 | – | 94 | 40 | 52 | 2 | 28 |
| Agrigan | 66 | 37 | 29 | 48 | – | 0 | 0 | 0 | 0 | 66 |
| Anatangan | 0 | 0 | 0 | 5 | – | 1 | 0 | 1 | 0 | – |
Source: 1930 Japanese Census of Micronesia
Note: 1920 figure for Northern Islands combines them into one figure
Views: 205